There are 42 teams averaging over 40 points a game. Maplesville takes over from
Calera for the lead by averaging
61.0 points per game followed by
Calera at 56.3 and Edgewood Academy with an average of 53.0. Southeastern has yet to
score this season.
For the second year in a row, Muscle Shoals refuses to give up points, having yet to allow their goal line to
be crosses this season. Last year they allowed only a field goal through their
first four games. On the other end, Sumter Central is giving
up an average of 56.3 points per game during the first four weeks of the 2013
season.
Maplesville leads in point differential average by defeating three opponents
by an average of 56.5 points. Calera is second with an average winning
margin of 48.3 in their four wins.
2013 Scoring Average
Rank
Team
Games
Avg.
1
Maplesville
4
61.0
2
Calera
4
56.3
3
Edgewood Academy
5
53.0
4
Marengo
4
52.5
5
Piedmont
4
52.0
6
McGill
4
51.5
7
Marion County
4
50.5
8
Jackson
4
49.5
9
Falkville
4
48.5
10
Saks
4
48.5
11
Monroe Academy
4
47.5
12
Madison Academy
4
46.8
13
Pickens County
4
46.8
14
Marengo Academy
4
46.5
15
Saraland
4
46.3
16
Colbert County
4
45.8
17
Dale County
4
45.8
18
Tuscaloosa Academy
4
45.5
19
Fort Dale Academy
4
45.3
20
Muscle Shoals
4
45.3
21
Auburn
4
45.0
22
Clay-Chalkville
4
45.0
23
Hoover
4
44.5
24
Cedar Bluff
4
44.0
25
Good Hope
4
43.8
26
Sardis
4
43.8
27
Oakman
4
42.8
28
Washington County
4
42.8
29
Kingwood Christian
5
42.6
30
Benjamin Russell
4
42.3
31
Fultondale
4
42.3
32
T.R. Miller
4
42.3
33
Beauregard
4
42.0
34
Fyffe
4
41.8
35
Luverne
4
41.5
36
Autauga Academy
4
41.3
37
Linden
4
41.3
38
Spanish Fort
4
41.3
39
Center Point
4
41.0
40
Mobile Christian
4
40.3
41
Smiths Station
4
40.3
42
Lamar County
4
40.0
2013 Defense Average
Rank
Team
Games
Avg.
1
Muscle Shoals
4
0.0
2
Central Clay County
4
3.5
3
Colbert County
4
4.3
4
Maplesville
4
4.5
5
Loachapoka
4
5.3
6
Cottonwood
4
5.5
7
Restoration Academy
5
5.6
8
Hoover
4
6.0
9
Spanish Fort
4
6.0
10
Falkville
4
6.5
11
Madison Academy
4
6.5
12
Straughn
4
6.5
13
Piedmont
4
6.8
14
J.O. Johnson
4
7.0
15
Brooks
4
7.3
16
Etowah
4
7.8
17
Calera
4
8.0
18
Pickens County
4
8.0
19
Vestavia Hills
4
8.0
20
Jackson
4
8.3
21
Lamar County
4
8.3
22
Monroe Academy
4
8.3
23
Winfield
4
8.3
24
Marengo Academy
4
8.5
25
Saraland
4
8.5
26
Addison
4
8.8
27
Guntersville
4
8.8
28
Vigor
4
8.8
29
W.S. Neal
4
9.3
30
Hamilton
4
9.8
31
Linden
4
9.8
32
McAdory
4
9.8
33
New Hope
4
9.8
2013 Differential Average
Rank
Team
Games
Avg.
1
Maplesville
4
56.5
2
Calera
4
48.3
3
Muscle Shoals
4
45.3
4
Piedmont
4
45.3
5
Falkville
4
42.0
6
Colbert County
4
41.5
7
Jackson
4
41.3
8
Madison Academy
4
40.3
9
McGill
4
39.5
10
Monroe Academy
4
39.3
11
Pickens County
4
38.8
12
Hoover
4
38.5
13
Marengo Academy
4
38.0
14
Saraland
4
37.8
15
Saks
4
37.5
16
Spanish Fort
4
35.3
17
Cottonwood
4
34.3
18
Dale County
4
34.0
19
Edgewood Academy
5
33.6
20
Lamar County
4
31.8
21
Restoration Academy
5
31.8
22
Linden
4
31.5
23
Marengo
4
31.5
24
Sardis
4
31.0
25
Benjamin Russell
4
30.3
26
Washington County
4
29.3
27
Good Hope
4
28.0
28
Fultondale
4
27.5
29
Brooks
4
27.3
30
Fyffe
4
27.3
31
Winfield
4
26.3
32
Clay-Chalkville
4
26.0
33
Addison
4
25.8
34
Central Florence
4
25.8
35
Oakman
4
25.8
36
Sweet Water
4
25.8
37
Tallassee
4
25.8
38
Auburn
4
25.5
39
Loachapoka
4
25.0
40
Mobile Christian
4
25.0
Great Moments in Alabama High School Football History
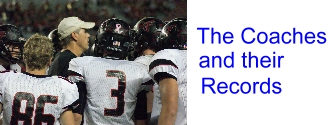
From 1947 until his retirement in 1992 Glenn Daniel's teams won 302 games at Pine Hill and Luverne. He was the winningest coach in state history until 2010.